⏱️ See where every business stands, and where it's stuck.
Where exactly does a new business get stuck before going live?
Your Onboarding Insights dashboard now shows the full picture: how long onboarding takes, where businesses are getting stuck, and where new business is coming from. For agency users, this means bottlenecks surface early, backed by data instead of guesswork.
What's New
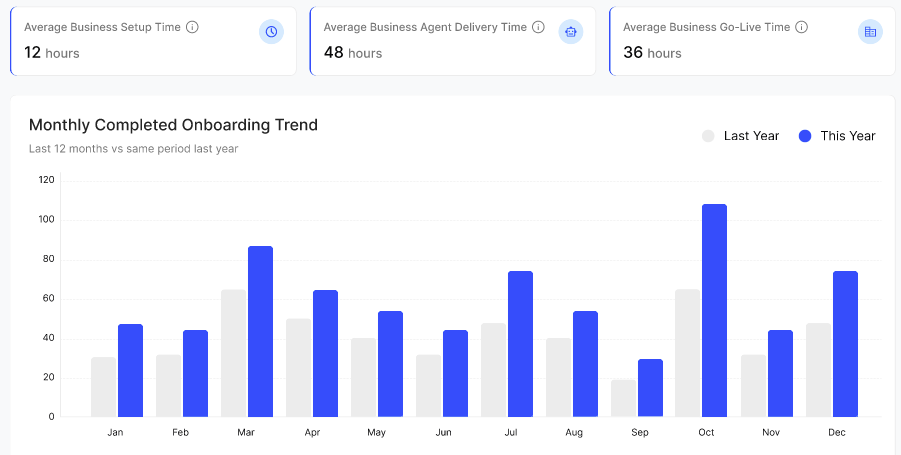
Stage Timers: Three timers at the top, Setup Time, Agent Delivery Time, and Go-Live Time, show exactly where the process slows down.
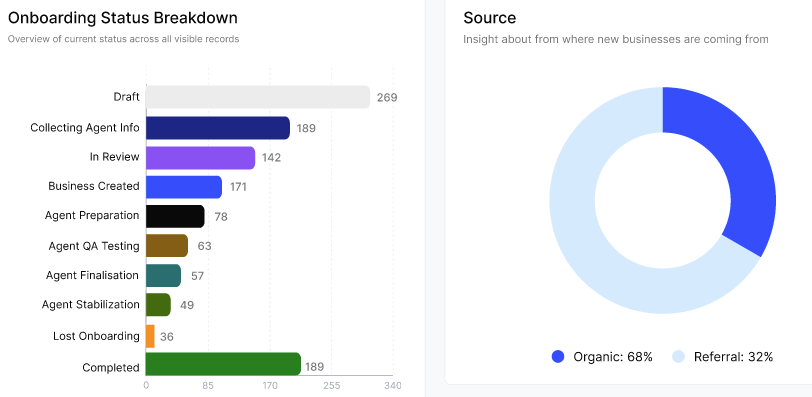
Status Breakdown: See how many businesses sit in each onboarding stage right now, so a backlog is visible before it turns into a problem.
Pipeline Source Chart: A source chart shows how much of your pipeline is organic versus referral.
Why This Matters
For agency users, this catches bottlenecks early instead of after a customer's been waiting weeks. Your team knows exactly where to focus, with numbers to back the decision instead of relying on guesswork.
📍 Where to find it: Go to Onboarding → Insights (top right corner), once you are in the insights view for onboardings.