Business Onboarding Insights
Written By Maruf Ansari
Last updated 19 days ago
The Business Onboarding Insights module gives agency users visibility into the entire onboarding lifecycle of a business — from the moment a business is created in the portal to the point its AI agent is fully live and stable. It combines time-based performance metrics, historical trends, pipeline status distribution, and acquisition source data, helping agencies identify bottlenecks in the onboarding process and measure how efficiently new businesses are being brought onto the platform.
Summary Cards
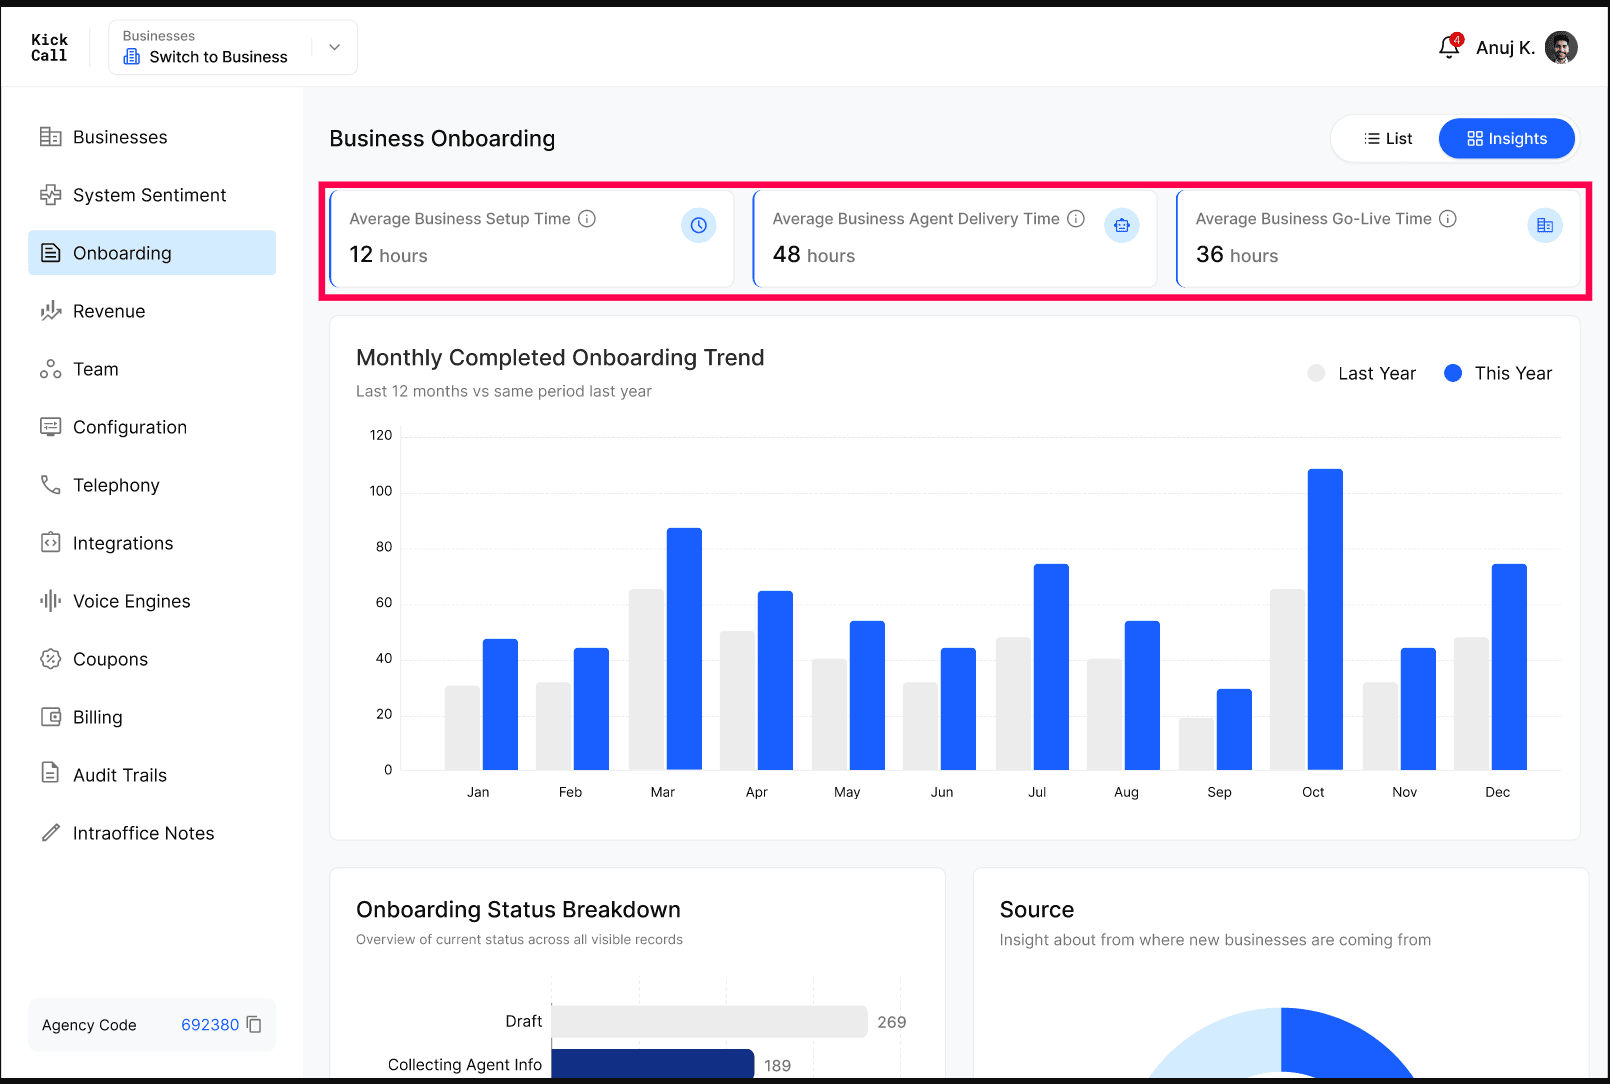
Three cards at the top display average time metrics across the onboarding process:
Average Business Setup Time – Time between a business completing the agent info form and their account being created in the portal.
Average Business Agent Delivery Time – Time between the business being created in the portal and the agent being finalized.
Average Business Go-Live Time – Time between agent finalization and the agent being fully stabilized.
Monthly Completed Onboarding Trend
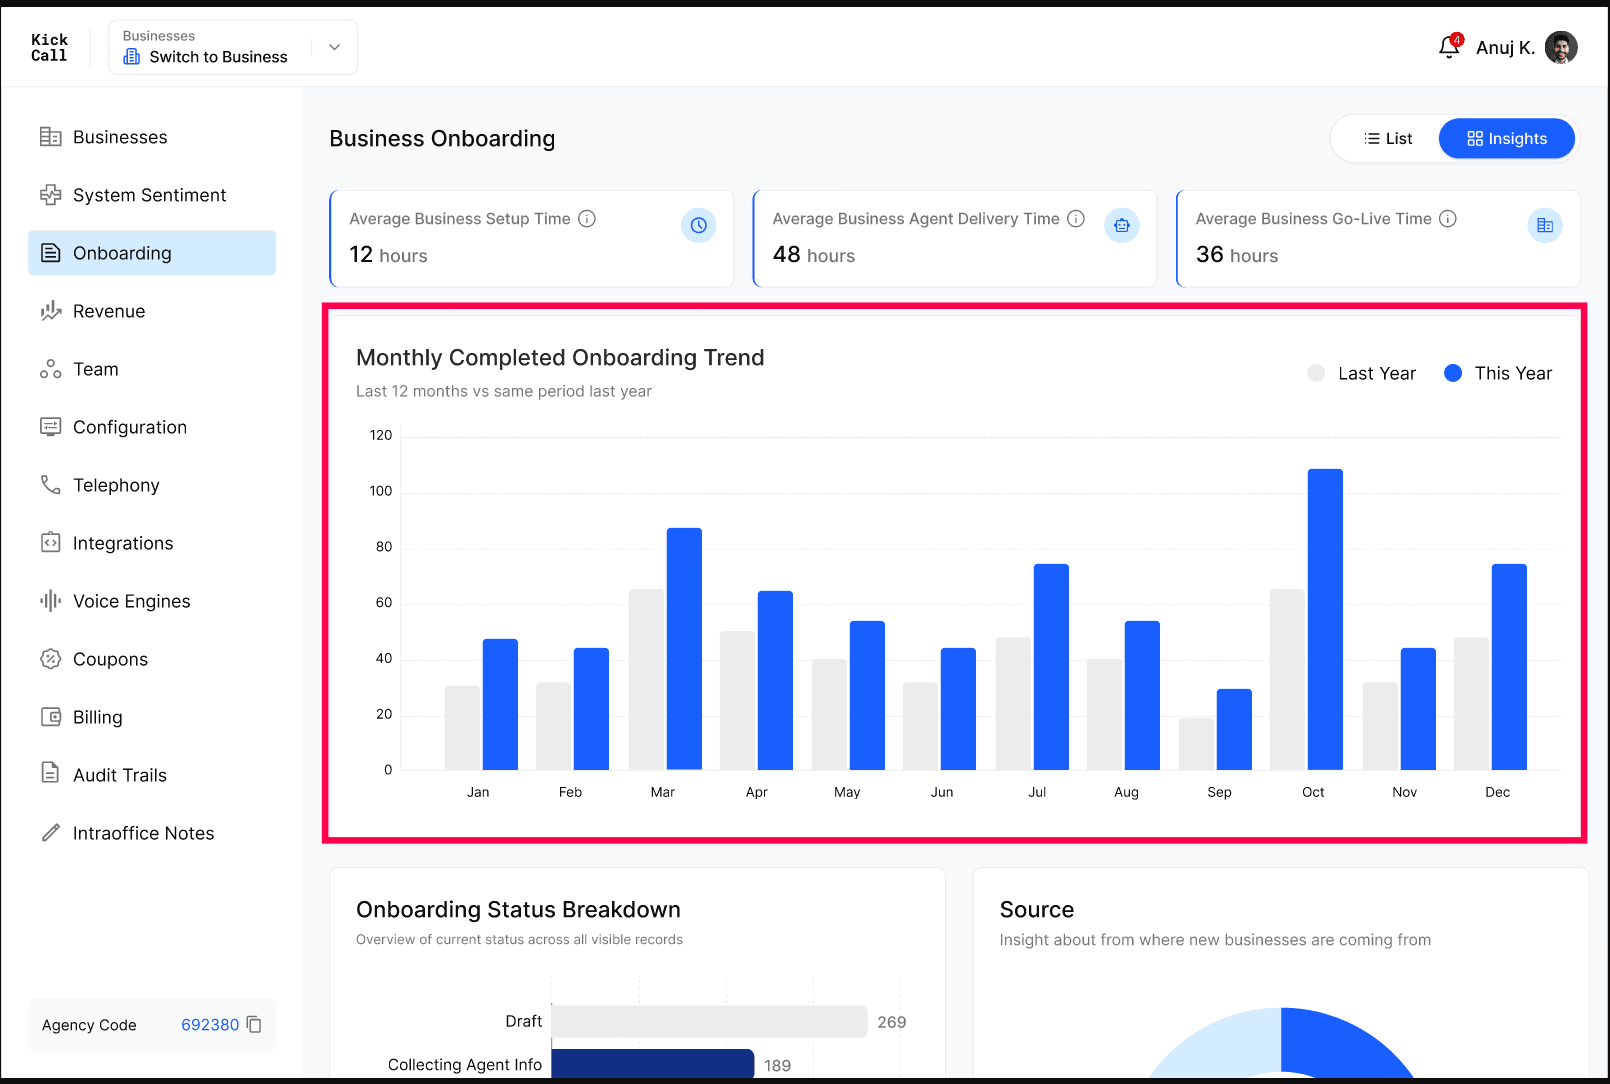
A bar chart comparing the number of completed onboardings per month for This Year (blue) versus Last Year (grey), helping identify onboarding volume trends and seasonal patterns.
Onboarding Status Breakdown
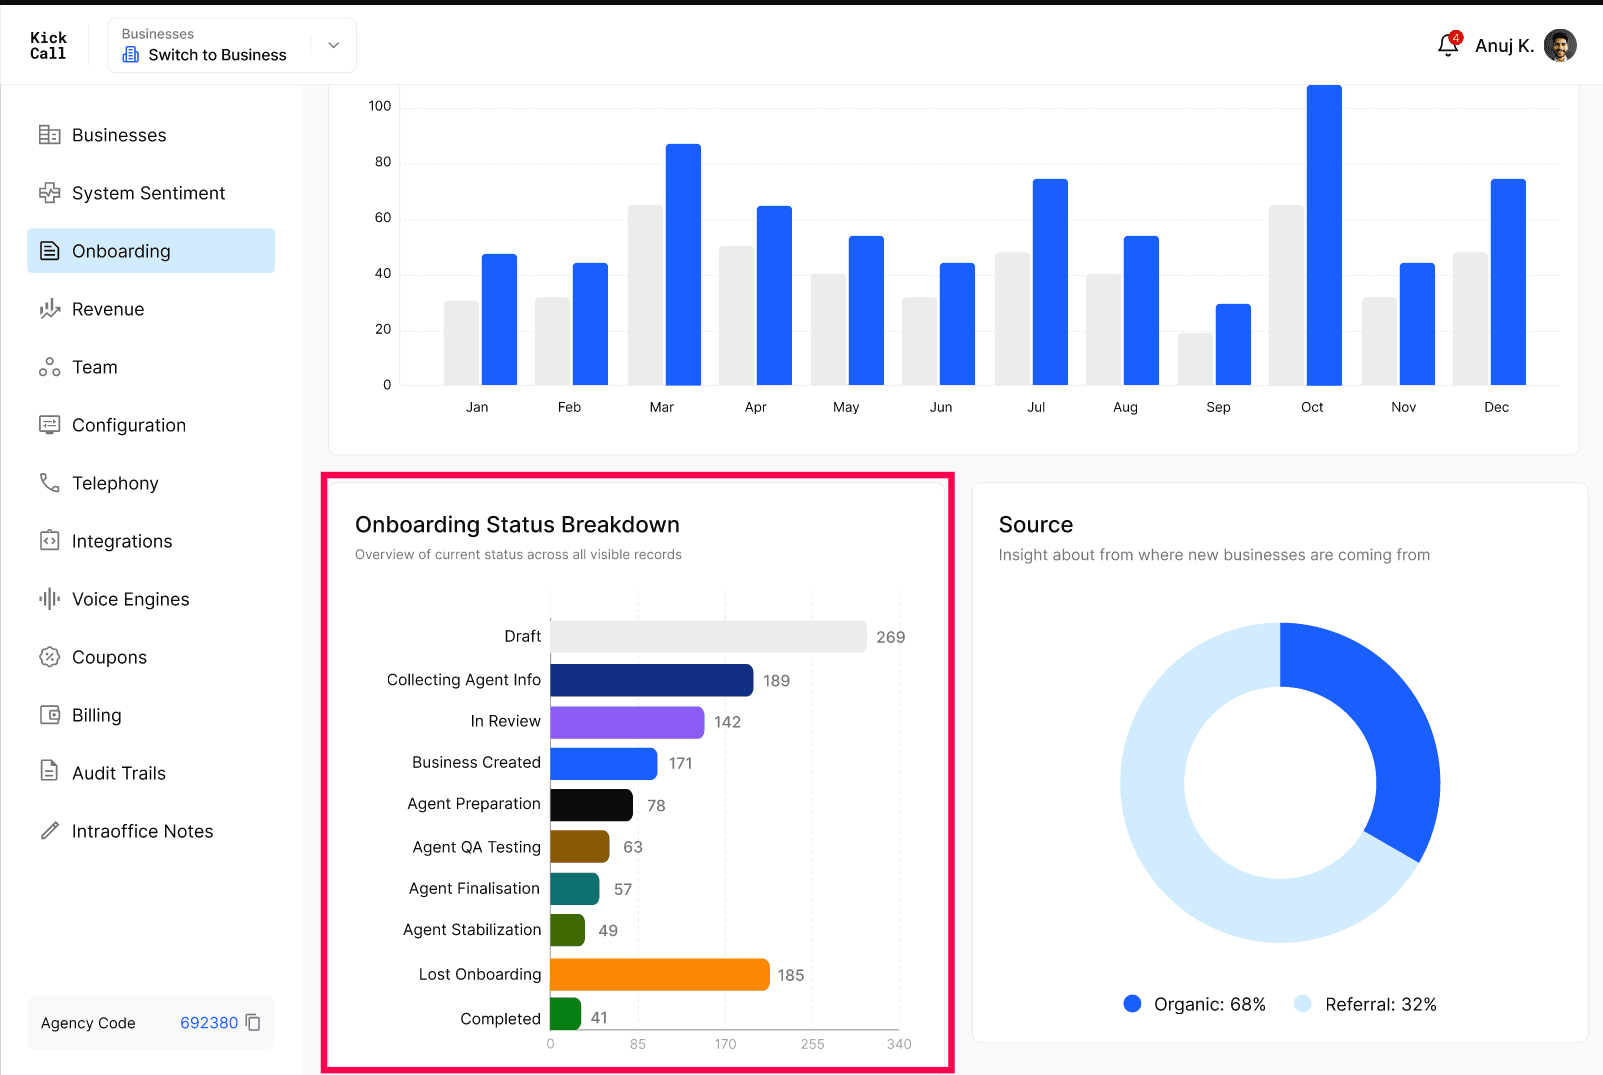
A horizontal bar chart showing the current count of businesses at each stage of the onboarding pipeline.
See Business Onboarding statuses for the full definition of each status and how a business moves between them.
Source
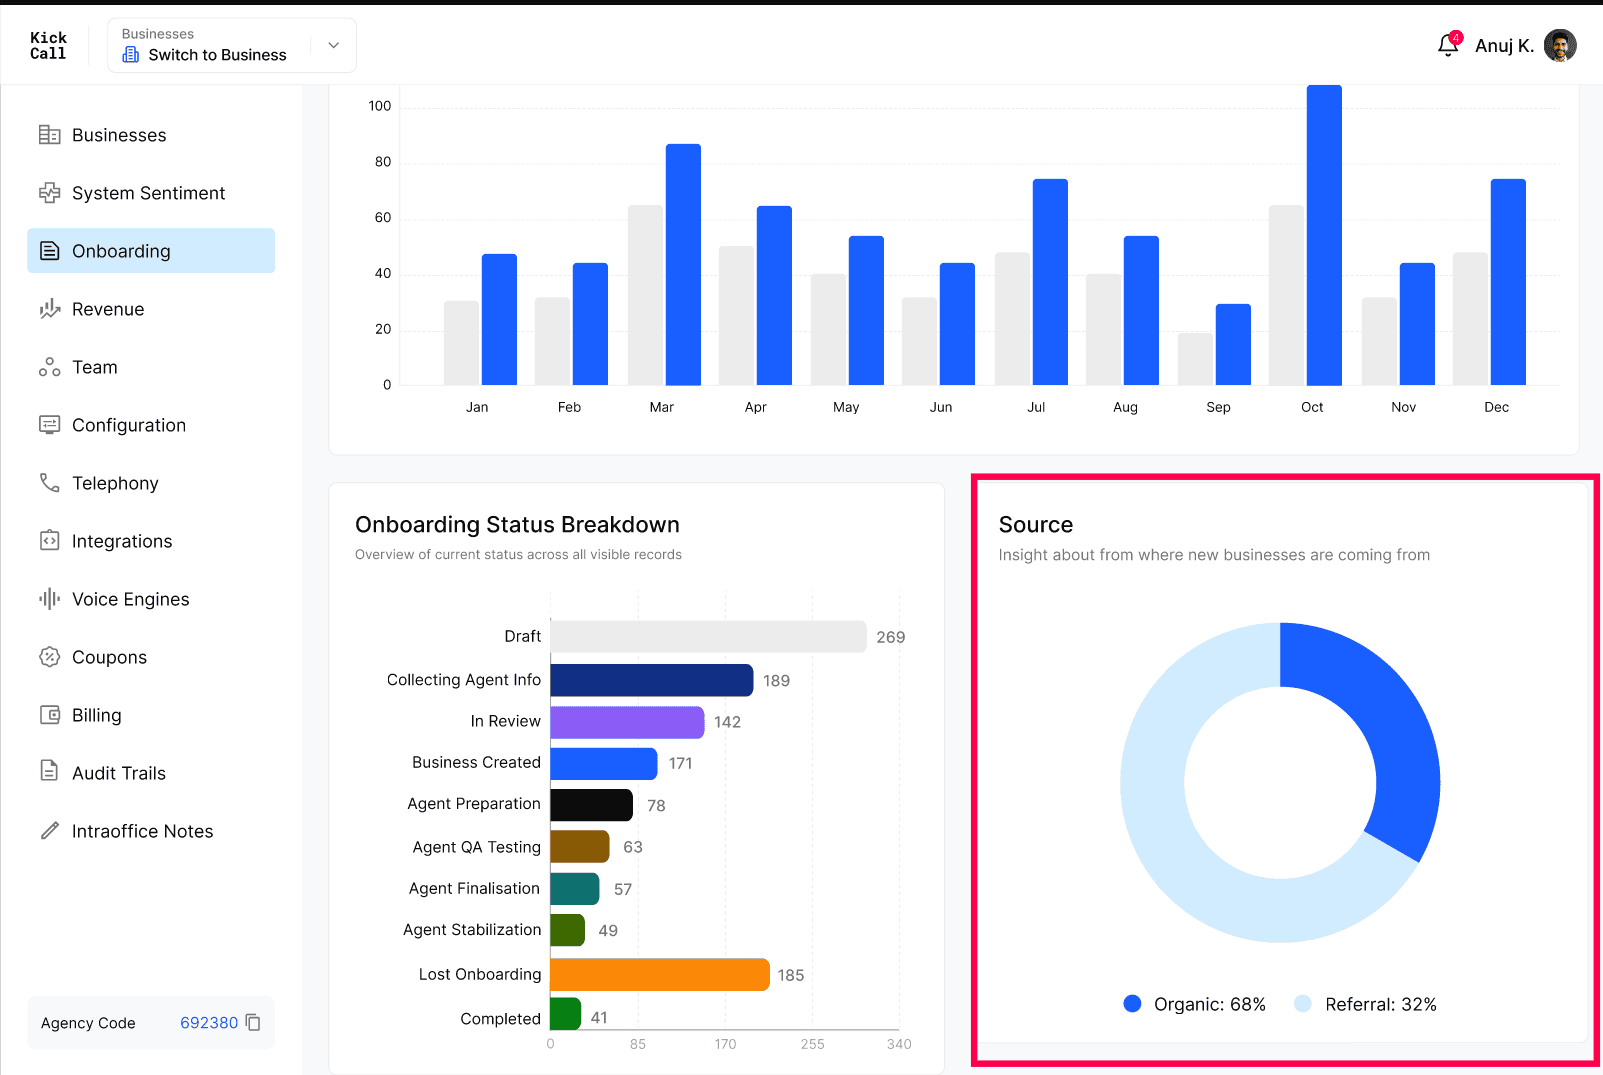
A donut chart showing where new businesses are originating from, broken down by Organic and Referral channels, helping agencies understand their acquisition mix.
Reasons for Choosing AI Receptionist
A horizontal bar chart that shows the most common reasons businesses selected for choosing an AI receptionist during onboarding. Each bar represents the total count of businesses that selected a specific reason, so you can quickly see what is motivating new signups and tailor your messaging, packages, and sales conversations accordingly.
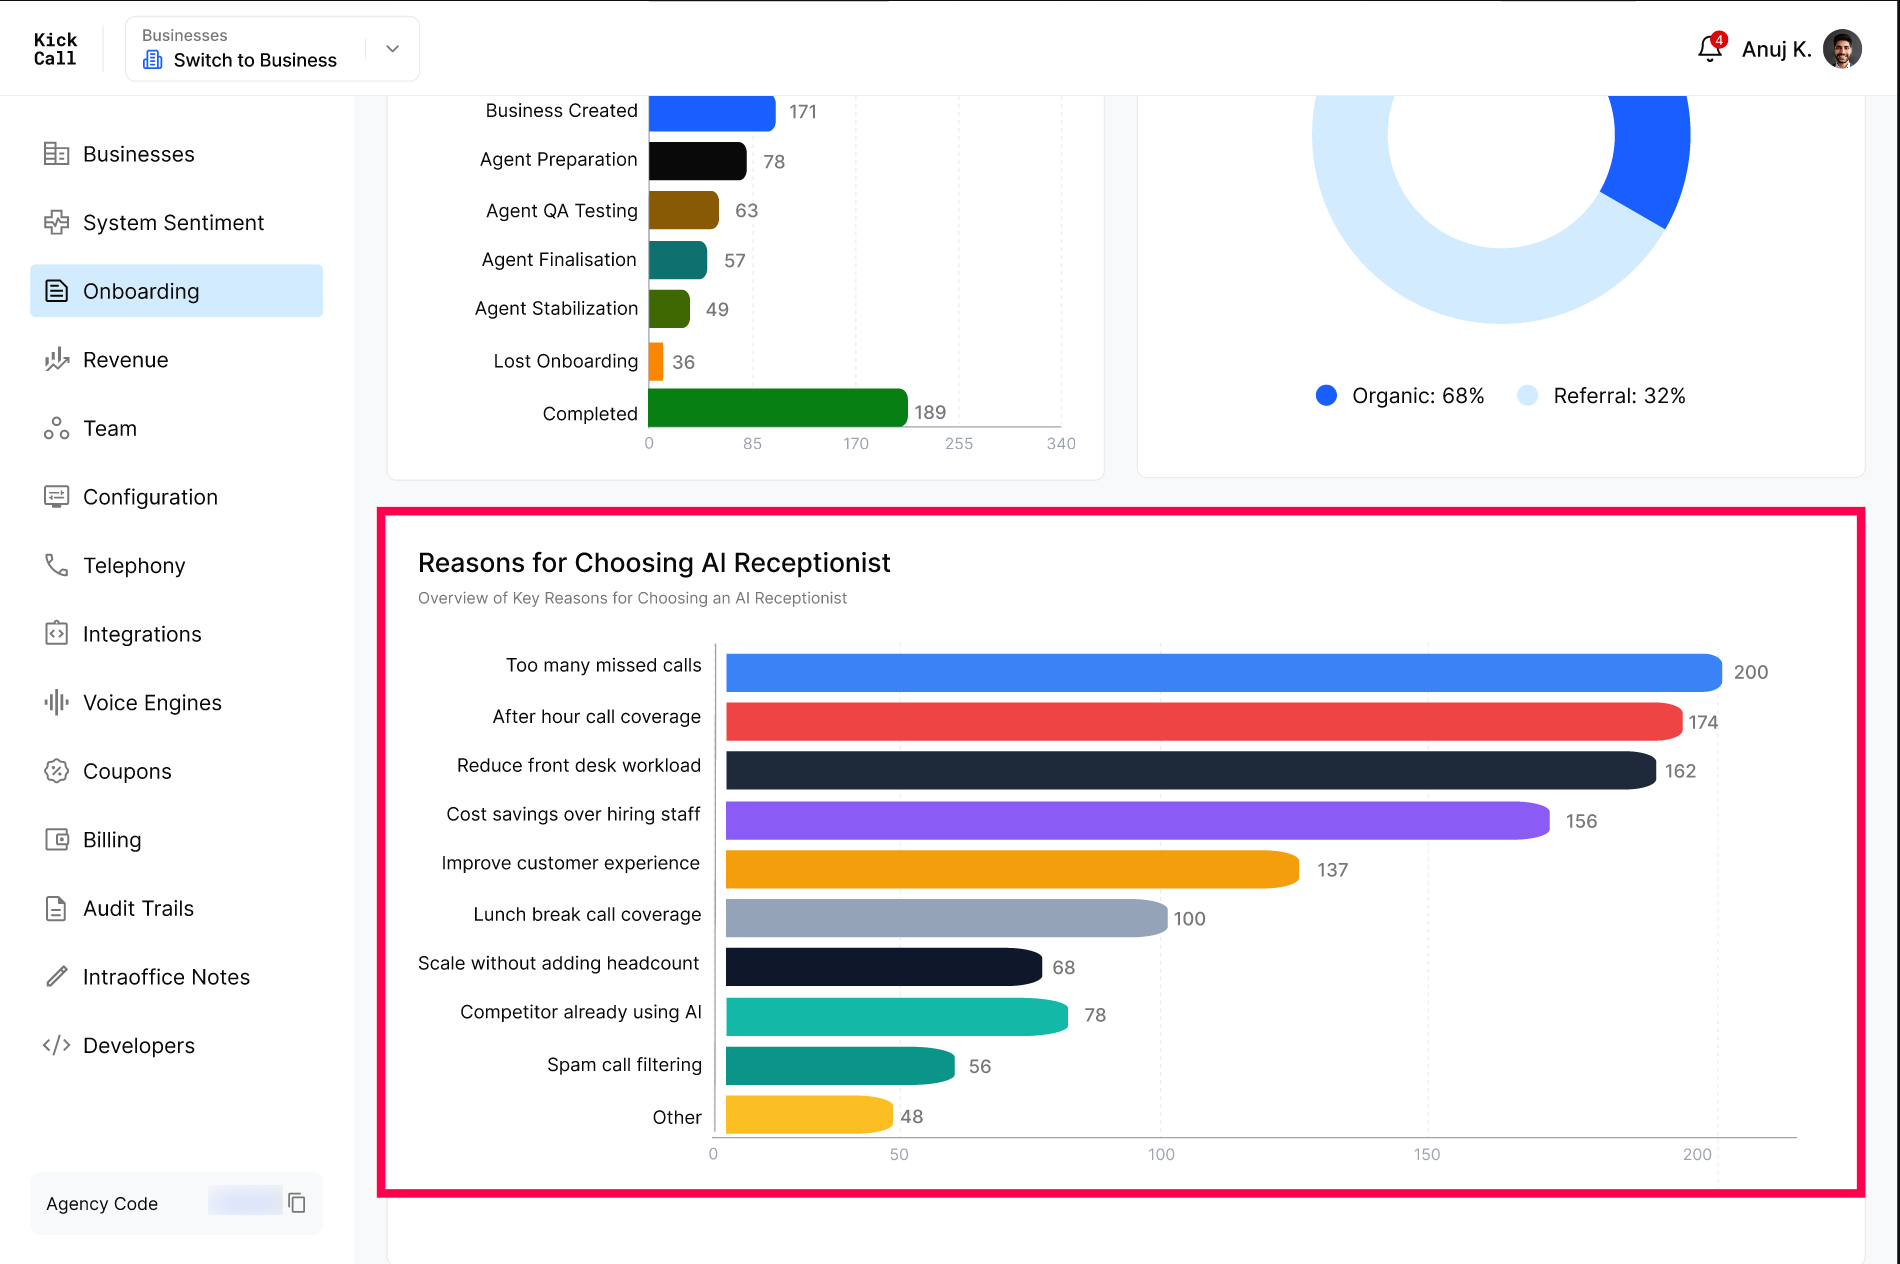
Common reasons include:
Too many missed calls — high call volume that staff cannot keep up with.
After hour call coverage — need for calls to be answered outside business hours.
Reduce front desk workload — offloading repetitive reception tasks from staff.
Cost savings over hiring staff — replacing or supplementing human reception with AI.
Improve customer experience — faster, more consistent caller interactions.
Lunch break call coverage — covering calls during breaks and shift gaps.
Scale without adding headcount — growing the business without proportional hiring.
Competitor already using AI — keeping up with market adoption.
Spam call filtering — reducing unwanted or low-value calls.
Other — any reason not covered by the standard options.
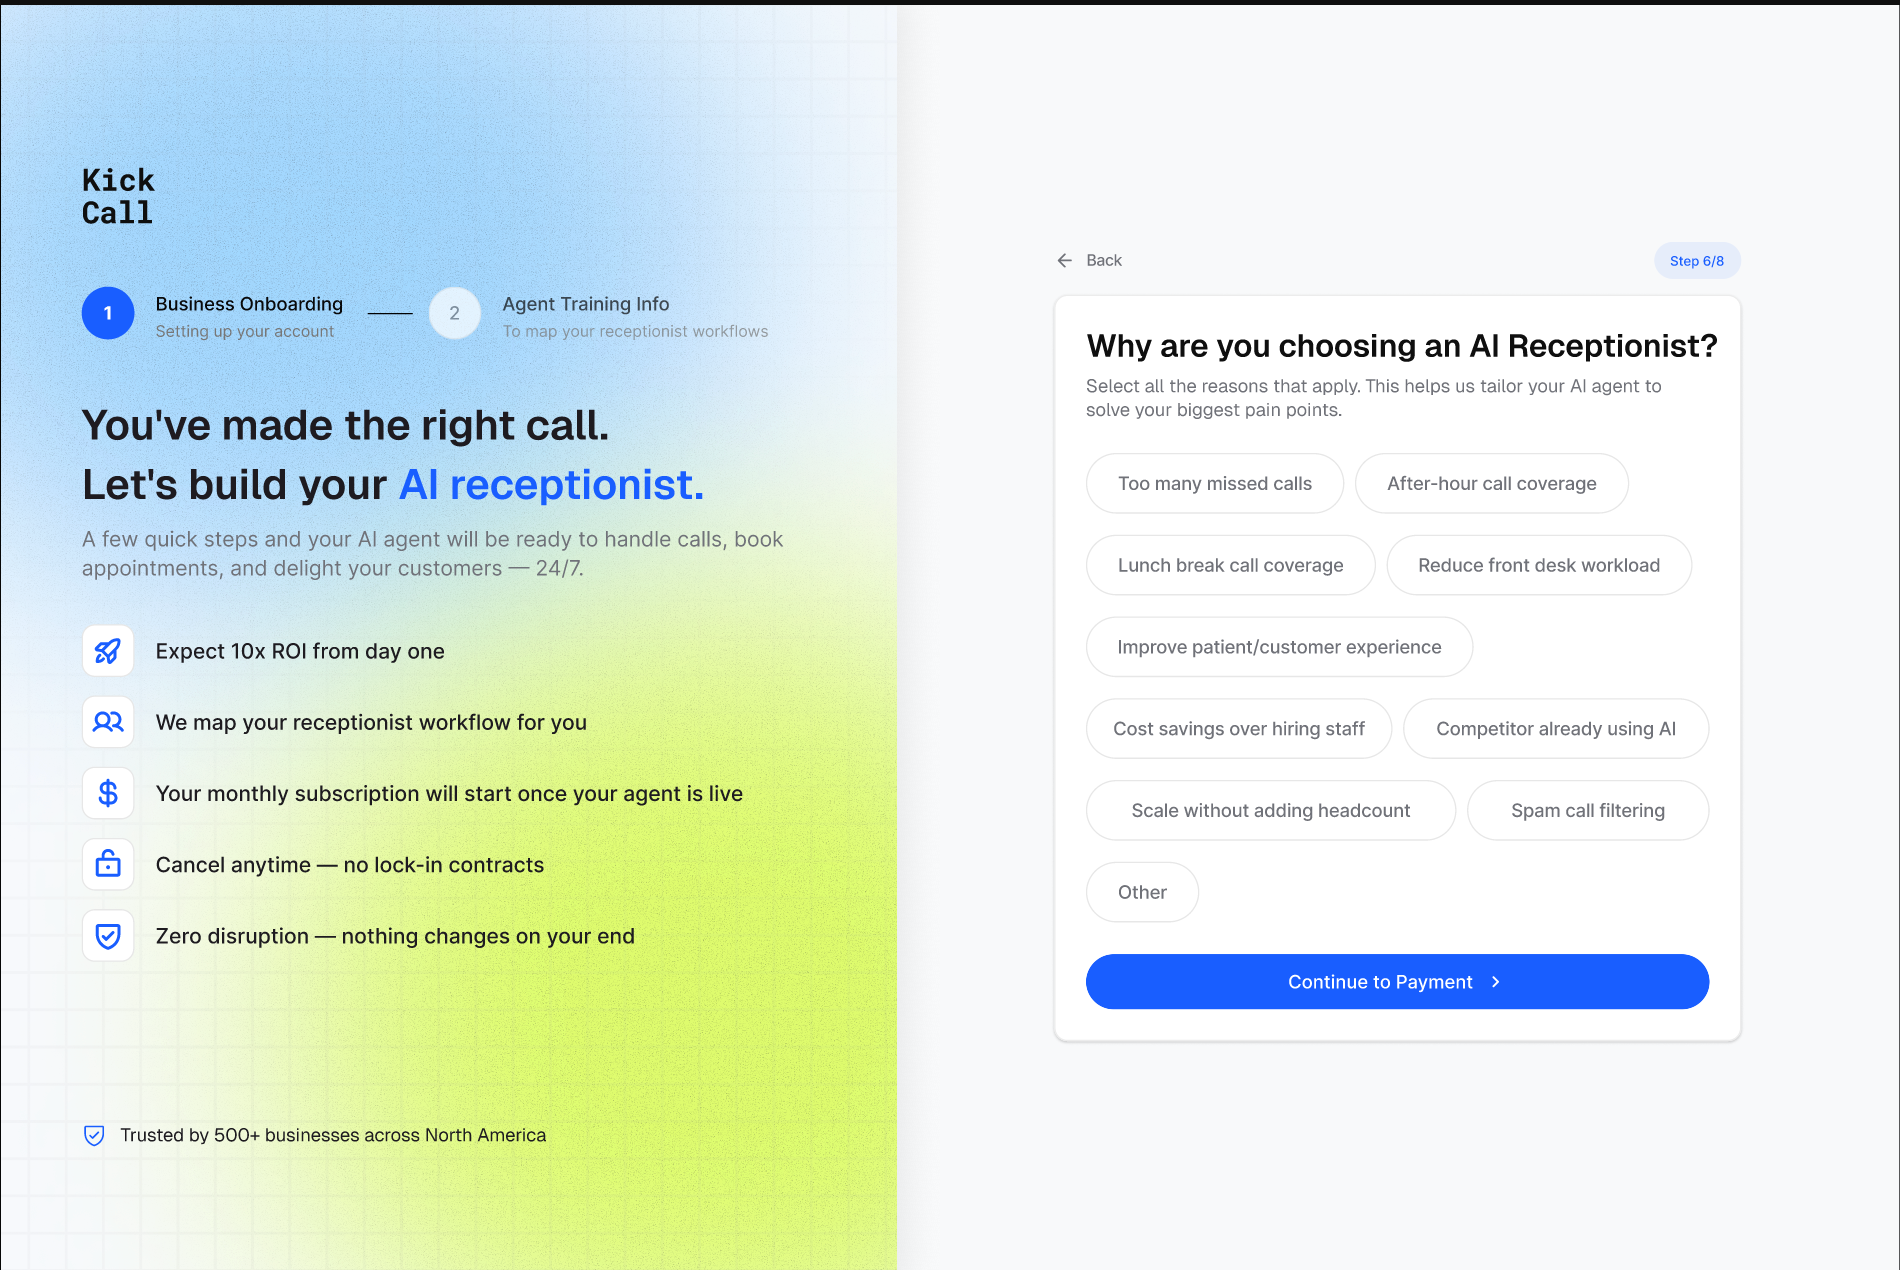
This data is collected from the Reason of Choosing Us field that businesses fill out during the onboarding form in the Public Portal. As businesses complete that step, their selections are aggregated here for reporting.
Frequently Asked Questions
How is Average Business Setup Time calculated?
How is Average Business Setup Time calculated?
It's the average time between a business completing the agent info form and their account being created in the portal — a measure of how quickly a business submitted it’s onboarding form.
What's the difference between Agent Delivery Time and Go-Live Time?
What's the difference between Agent Delivery Time and Go-Live Time?
Agent Delivery Time measures how long it takes to go from account creation to a finalized agent. Go-Live Time picks up from there and measures how long the agent takes to stabilize after being finalized.
Why does the trend chart compare this year to last year?
Why does the trend chart compare this year to last year?
Year-over-year comparison is the fastest way to spot seasonality and to sanity-check whether onboarding volume is growing or slowing versus the same period last year.
What counts as a "completed" onboarding on the trend chart?
What counts as a "completed" onboarding on the trend chart?
A business is counted as completed only when it reaches the Completed onboarding status — meaning the agent has been finalized and stabilized.
Where does the Source data come from?
Where does the Source data come from?
Source is captured during onboarding and split into Organic (self-serve signups) and Referral (businesses brought in through a referral link or partner). It helps you understand which channels are driving new business growth.
Can I click a status in the breakdown chart to see the businesses in that stage?
Can I click a status in the breakdown chart to see the businesses in that stage?
The breakdown is an aggregate view. To drill into specific businesses at a given stage, use the All Onboarding's & Actions list and filter by status.
Where is the "Reasons for Choosing AI Receptionist" data collected from?
Where is the "Reasons for Choosing AI Receptionist" data collected from?
It is collected from the Reason of Choosing Us field in the Public Portal onboarding form. When a business submits that step, their selected reason is recorded and aggregated into this chart.
Can a business select more than one reason for choosing an AI Receptionist?
Can a business select more than one reason for choosing an AI Receptionist?
Yes. If the onboarding form allows multiple selections, a single business can be counted against more than one reason, so the total count across all bars may be higher than the total number of onboarded businesses.
More in Onboarding
Was this helpful?
Still need help? Ask the team